# Scale function에 대하여
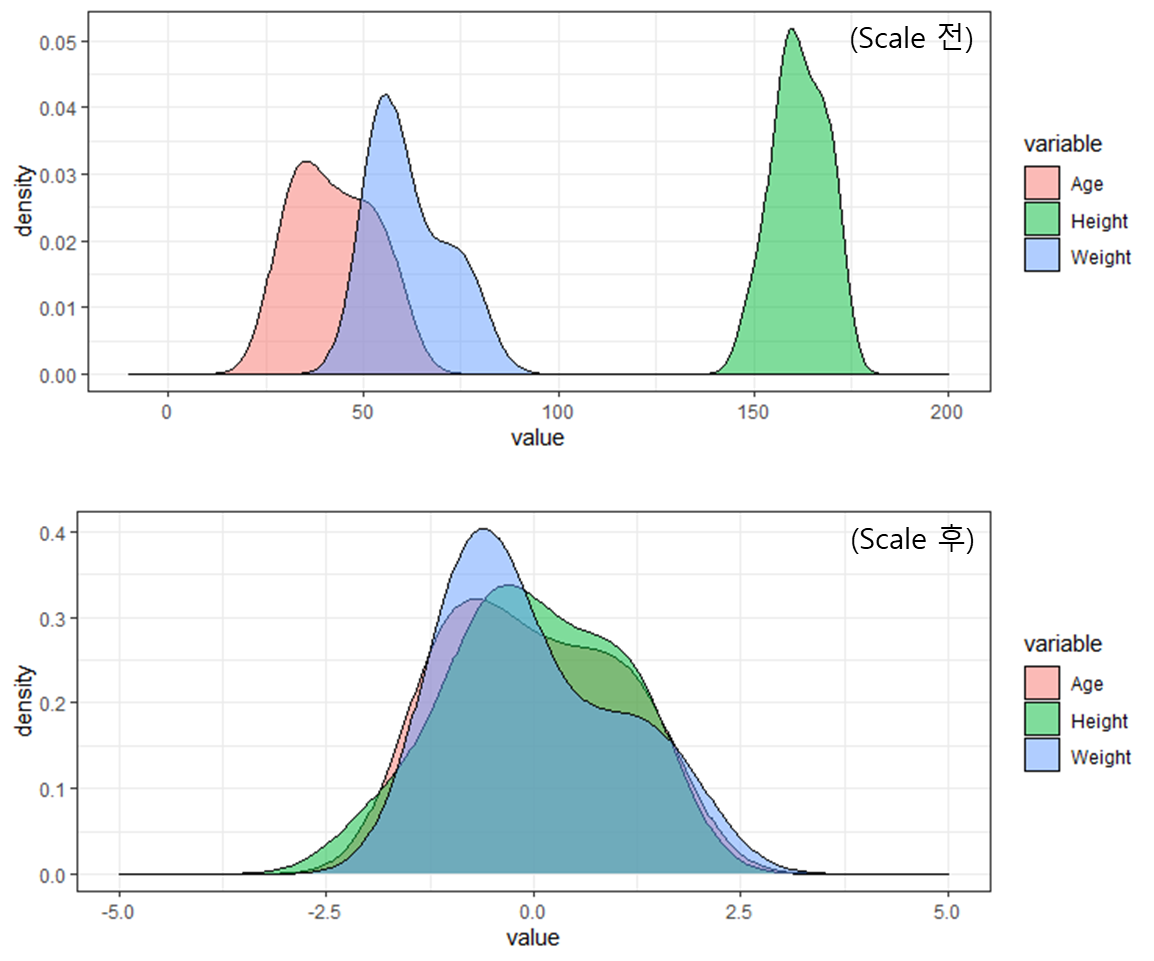
R에서 scale 함수는 Column-wise 하게 표준정규분포로 데이터의 분포를 이동시켜준다.
set.seed(1)
Data <- data.frame(
    Age = sample(30:60, 10, replace=T),
    Height = sample(150:170, 10, replace=T),
    Weight = sample(50:80, 10, replace=T)
)
(Scale 전과 후의 데이터의 분포)
library(reshape2)
library(ggplot2)

Data_melt <- melt(Data)
Data_scale_melt <- melt(data.frame(scale(Data)))
ggplot(Data_melt, aes(x=value, fill=variable)) + geom_density(alpha=.5) + xlim(c(-10,200)) + theme_bw()
ggplot(Data_scale_melt, aes(x=value, fill=variable)) + geom_density(alpha=.5) + xlim(c(-5,5)) + theme_bw()

scale된 결과를 보면, 표준정규분포의 파라미터에 해당하는
두가지 값 (평균, 표준편차)이 변수의 속성으로 포함되어있는 것을 확인할 수 있다.
> scale(Data)
              Age     Height     Weight
 [1,]  1.15335531  0.9668816  0.8723955
 [2,] -0.93461551 -1.7956372 -0.7893102
 [3,] -0.63633396  1.2738281 -0.3738838
 [4,] -1.23289706  1.2738281  1.2878219
 [5,] -1.13346987 -0.4143778  0.1453992
 [6,]  1.55106404  0.1995152 -0.7893102
 [7,]  0.95450095 -0.4143778 -0.7893102
 [8,] -0.23862524 -0.8747976 -1.1008800
 [9,]  0.05965631 -0.5678511 -0.2700272
[10,]  0.45736504  0.3529885  1.8071049

attr(,"scaled:center")
   Age Height Weight
  42.4  161.7   61.6

attr(,"scaled:scale")
      Age    Height    Weight
10.057612  6.515793  9.628661
(평균, 표준편차값이 center, scale 이라는 속성으로 들어가있는 값과 동일한 것 확인)
> lapply(Data, function(x) c( mean(x), sd(x) ) )
$Age: 42.40000 10.05761
$Height: 161.700000   6.515793
$Weight: 61.600000  9.628661
# Scale을 수행 한 데이터를 기반으로, 새로운 데이터에 적용하기
scaleTo 함수는 새로 들어오는 x라는 데이터에, 기존의 data에 적용하기 위해 계산되었던
평균, 표준편차 두가지의 변수를 가져와서 동일한 방법으로 normalization을 수행한다.
scaleTo <- function(x, trained) {
    x <- as.matrix(x)
    x <- sweep(x, 2L, attr(trained, "scaled:center"), FUN = "-") # 평균 빼기
    x <- sweep(x, 2L, attr(trained, "scaled:scale"), FUN = "/") # 표준편차 나누기
    attr(x, "scaled:center") <- attr(trained, "scaled:center") # attribute 설정
    attr(x, "scaled:scale") <- attr(trained, "scaled:scale")
    return(x)
}
# Train 데이터와 동일한 분포임을 확인
> TrainScaled <- scale(Data)
> Test <- Data[1:3,]
> scaleTo(Test, TrainScaled)

         Age     Height     Weight
1  1.1533553  0.9668816  0.8723955
2 -0.9346155 -1.7956372 -0.7893102
3 -0.6363340  1.2738281 -0.3738838

attr(,"scaled:center")
   Age Height Weight
  42.4  161.7   61.6

attr(,"scaled:scale")
      Age    Height    Weight
10.057612  6.515793  9.628661
잘 동작한다..
'Programing > R- programming' 카테고리의 다른 글
| libmysqlclient.so.20 RMySQL 에러 (0) | 2024.03.25 |
|---|---|
| R - Cross-validation 평균 ROC 그리기 (1) | 2022.10.02 |
| 몬티홀 딜레마, R 프로그래밍 솔루션 (0) | 2021.09.14 |
| R java.lang.OutOfMemoryError: Java heap space 에러 (0) | 2020.03.18 |
| RMySQL: Can't connect to local MySQL server through socket '/tmp/mysql.sock' 에러 (0) | 2019.09.12 |